
GA4’s Path exploration report records user journeys as a tree graph, such as the stream of events triggered or the page and screen classes or names viewed. At this point you may be wondering:
“Path exploration and Funnel exploration are both used to analyse user behaviour on a website. What’s the difference between them?”
Both reports can be used to analyse the steps users take on a website. But Funnel exploration analyses a single predefined path, while Path exploration can track any number of unspecified paths. You just set up the nodes, and you can see the paths users follow.
1. Start with the use case
Users’ browsing paths help a brand understand the customer journey in more depth, and can reveal blind spots in website design. If you have any of the following analysis needs, try using the Path exploration report to solve or rule out the problem:
- After landing on the home page, which page do new users open most often?
- At which step in a process do users get stuck?
- Where do users who view this page go next?
- How does browsing behaviour differ between audiences with high and low conversion rates?
- What pages or actions do shoppers go through before removing items from their cart?
2. Report interface guide
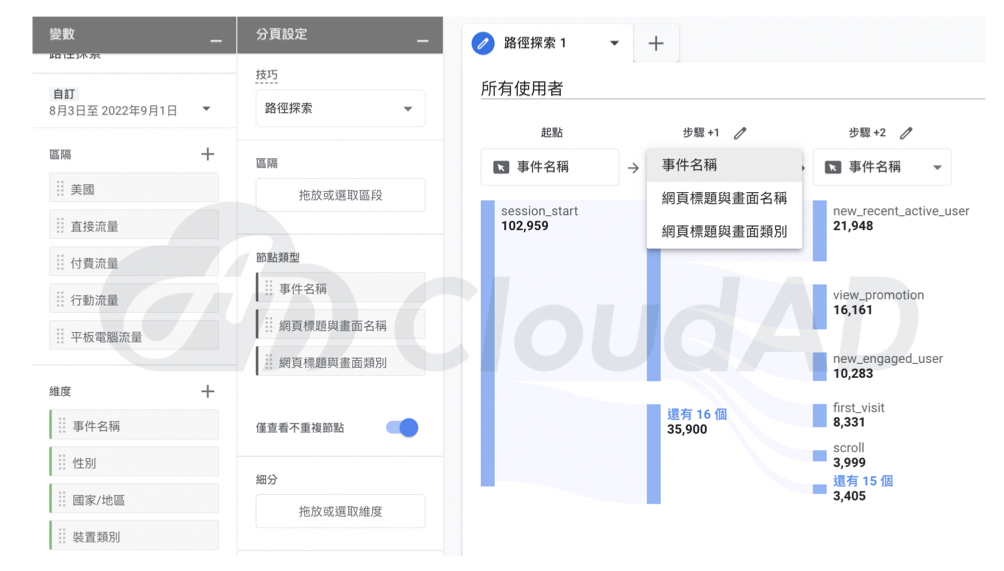
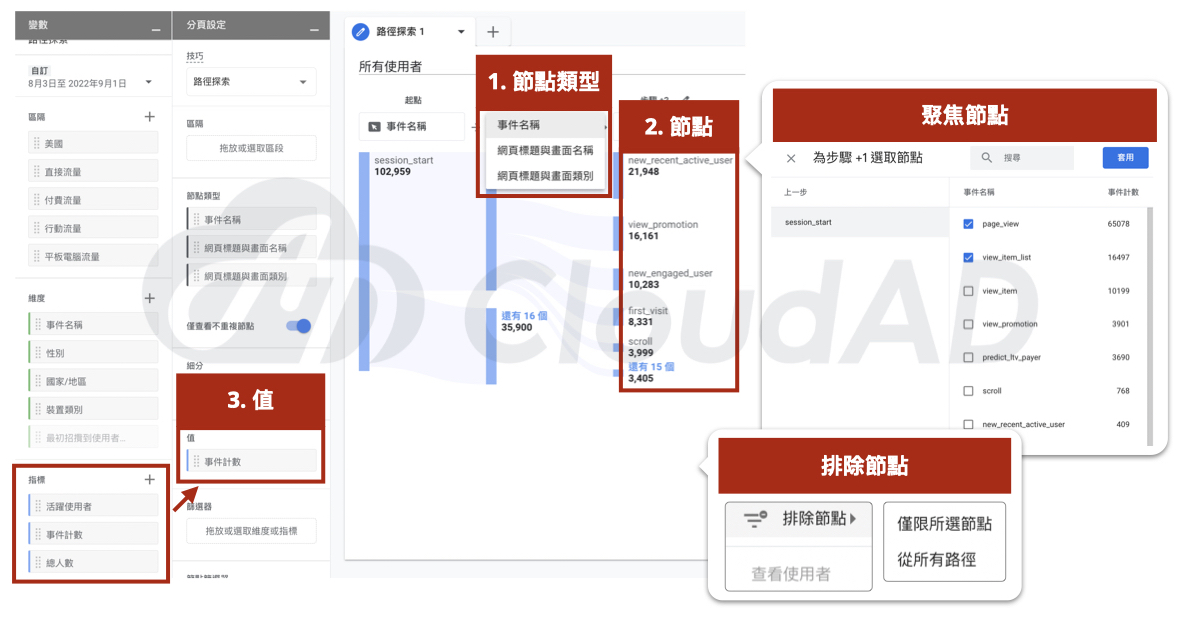
Path exploration shows users’ browsing paths based on the steps and values you set. Each time you add a new step, you must choose the node type and the nodes you want to look at for that step.
- Node type: how the step is presented (the dimension value), such as event name, page title and screen name, or page title and screen class.
- Node: the data points shown for that step, based on the node type. For event name, for example, these might be session_start, page_view or Add_to_cart; for page titles, they might be the home page, product page names or member registration.
- Value: how the metric is calculated for each node, such as event count, total users or active users.
To see how many users who land on the home page go on to visit other pages, you can set up the step like this:
– Node type: page title and screen name
– Value: total users
Nodes can also be focused, excluded or expanded:
- Focus: click the edit icon next to a step to choose the nodes you want to look at
- Remove: right-click a node you don’t need to show and click “Exclude node”, and the node will disappear
- Expand: click “X more” to show 5 more nodes, ordered from highest to lowest value.
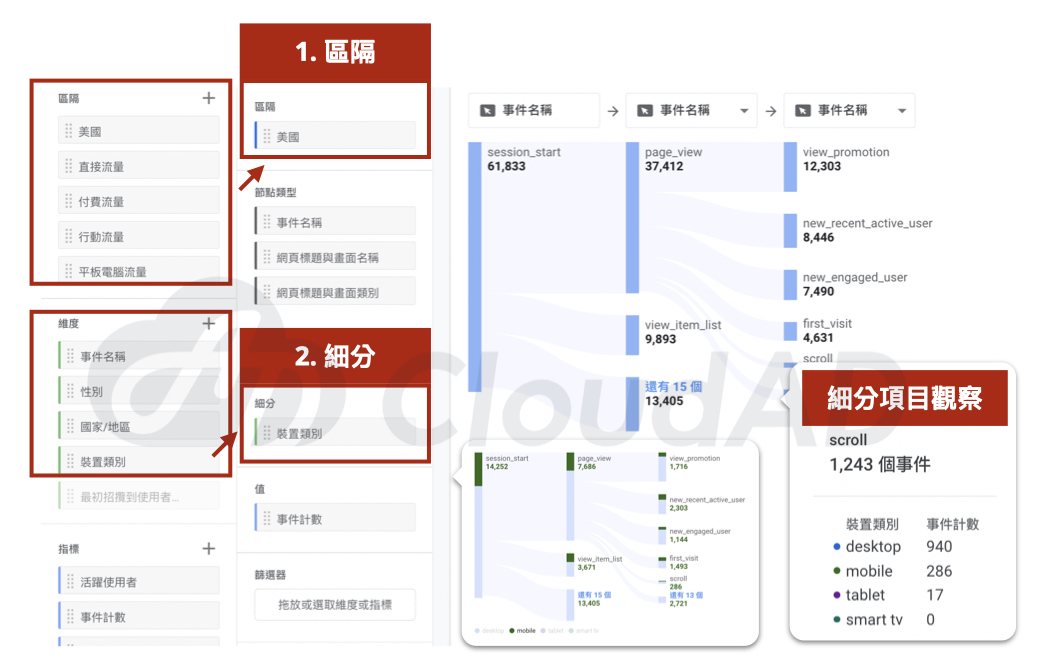
As well as defining steps, you can set your own segments and breakdown dimensions in the Path exploration report, to compare behaviour and browsing paths between audiences in different segments, and understand what makes up each node.
– To compare the browsing behaviour of users with high and low conversion rates, use segments.
– To see the share of each device in a node, use a breakdown to add another dimension.
3. Ways to analyse the report
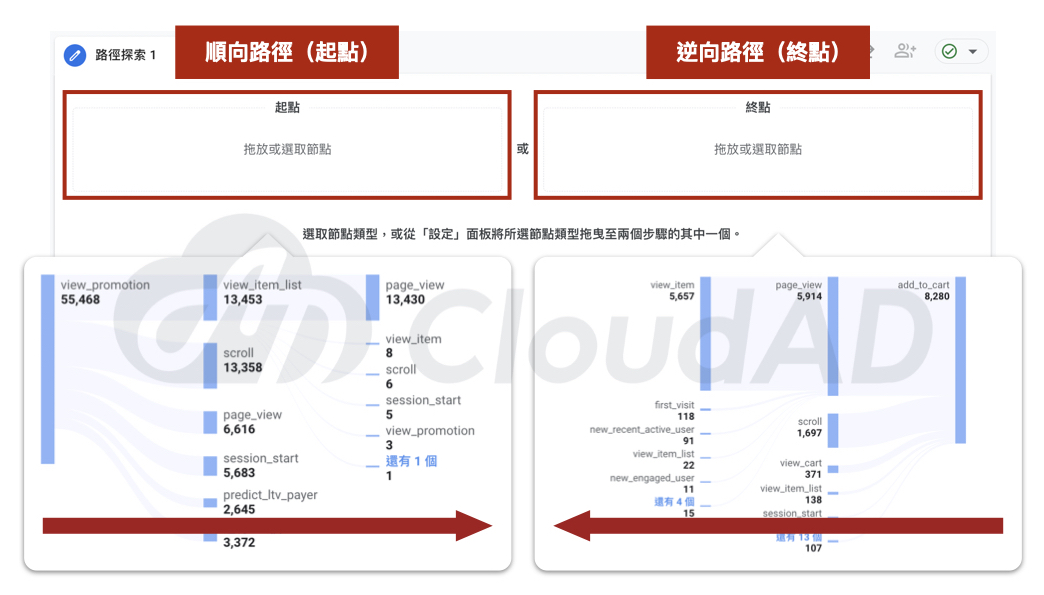
The Path exploration report offers two ways to analyse paths, forward paths and backward paths, which you can choose between depending on what the brand needs to analyse.
- Forward path (starting point): explore from a starting point where users go next, in terms of pages visited and behaviour.
For example, a brand can see which pages new customers view after visiting the website, and identify the products, campaigns or messaging that attract new customers, to inform ad targeting or new-customer campaign planning. - Backward path (end point): explore from an end point back to the source, to find why a path or behaviour happened.
For example, look at which pages users view before removing items from their cart, to find how the brand’s messaging should be adjusted, or blind spots in the website design.
To get to know GA4’s Path exploration report, you just need to master four areas: steps, node composition, segments and breakdowns, and direction of analysis. With these, you can understand users’ journeys and find the key to your marketing messaging strategy and website optimisation. If you have any questions about GA4 or would like to discuss our services, get in touch.