
The marketing funnel is a familiar tool for planning media and communication journeys, a long-standing part of any marketing plan. But once a strategy is live, tracking and analysing the performance of each funnel stage and the paths users take, quickly and effectively, is often a blind spot.
If you face the same problem, the Funnel exploration report in GA4’s advanced reports is worth knowing. Read on.
1. Start with the use case
GA4 reports are highly customisable and come with several built-in templates, which helps brands analyse faster. But with so many templates, filters and steps, it can also be hard to know where to start. If you have any of the following questions, try the Funnel exploration report to answer them or rule out possible causes:
- At which stage of the purchase process are customers dropping off?
- How long does it take to get from one action to the next step?
- How well does the media marketing funnel convert?
- How do first-time customers become regulars?
Whether you are looking at user behaviour, the shopping experience or media performance, making good use of reporting tools helps you find blind spots in your strategy and overcome obstacles to business growth.
2. A guide to the report interface
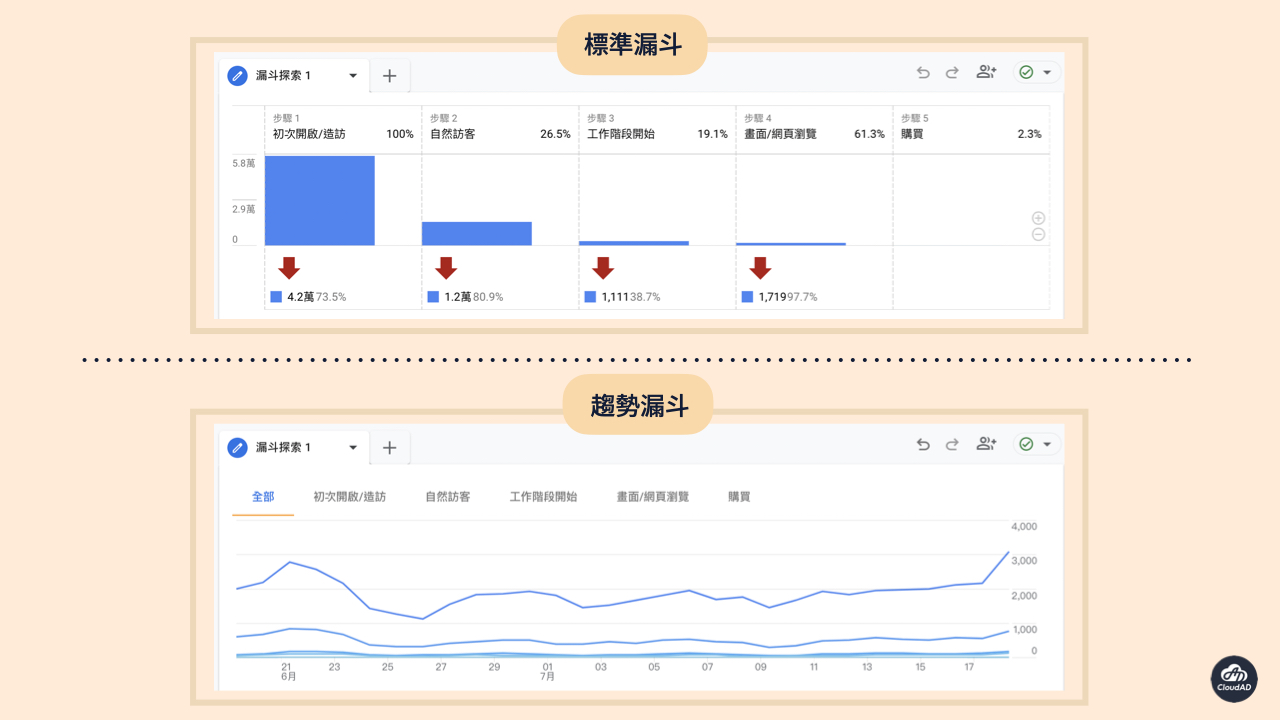
In GA4 Explore, select Funnel exploration from the template gallery. Under Visualisation, choose either a standard funnel (step chart) or a trended funnel (line chart).
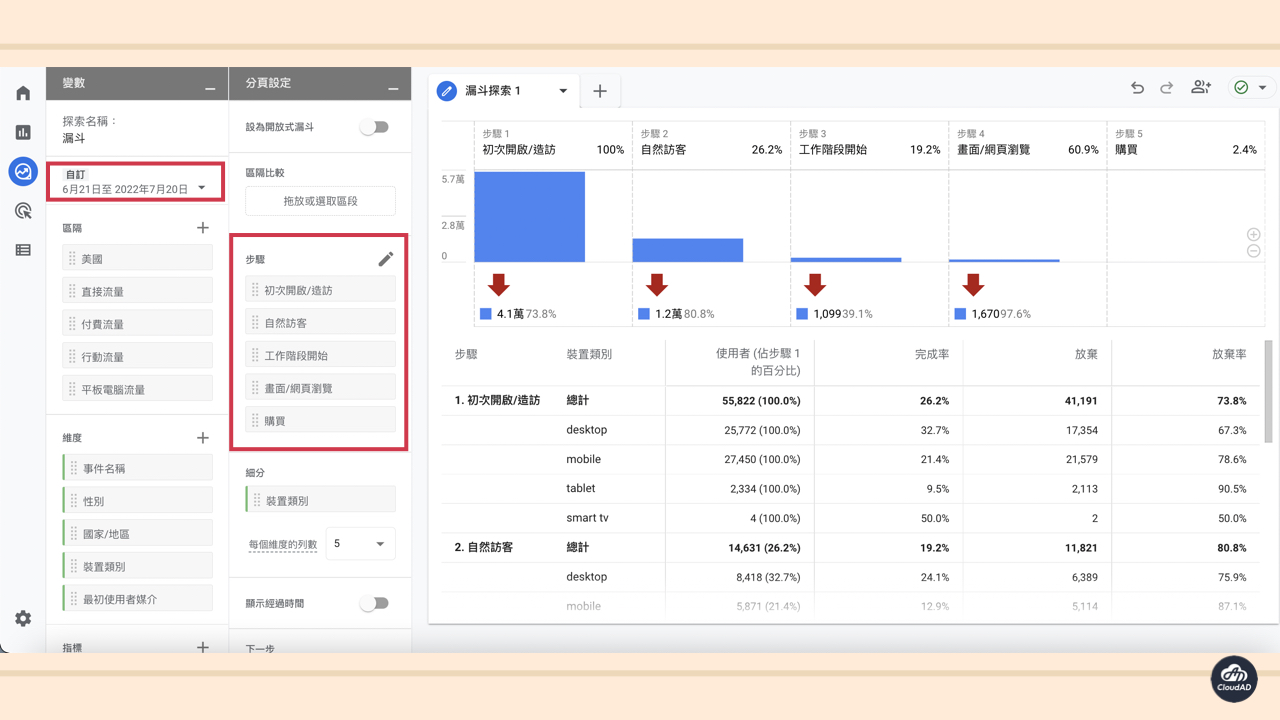
- Custom: set the date range for the analysis
- Steps: the user flow or behaviour you want to observe; pay attention to the order in which steps are added
For example: first visit/first open organic visitor session start screen/page view purchase. Beyond the basic count of how many users found the site through their own search and converted, we can also see how many people dropped off at each stage, and then review and strengthen specific parts of the flow.
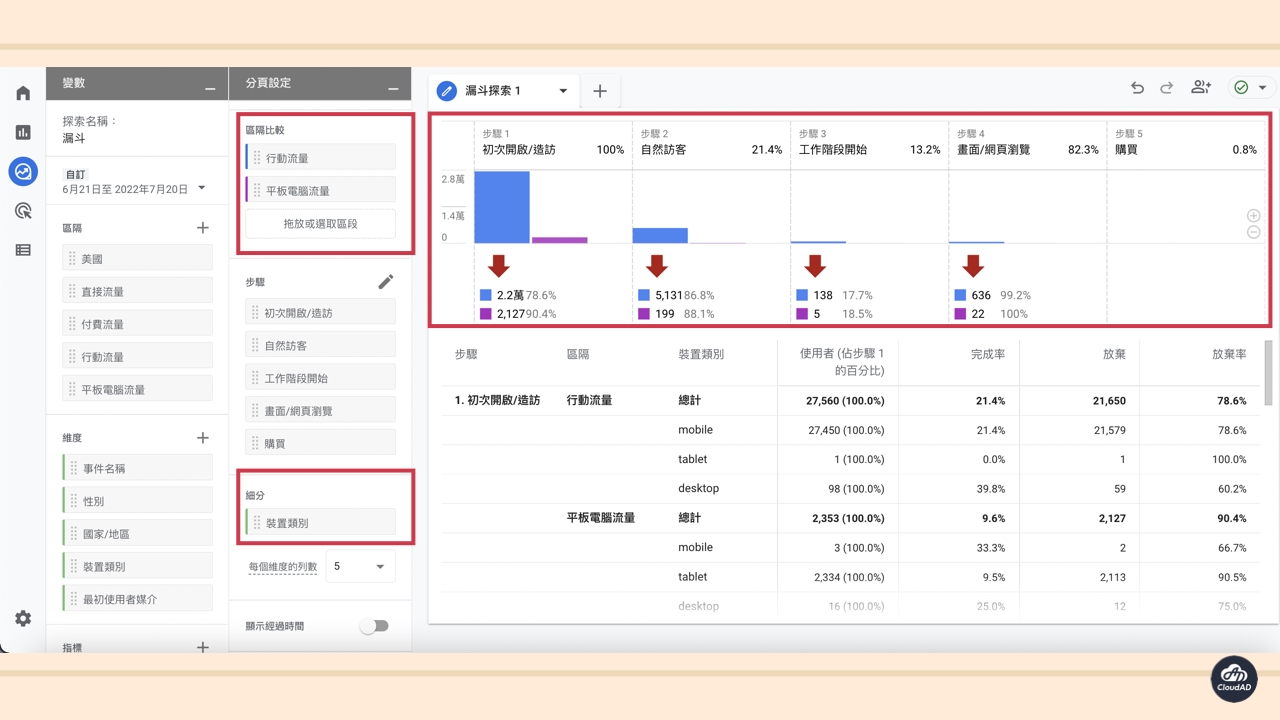
- Segment comparisons: drag in items from Segments to split traffic by attribute
- Breakdown: drag in items from Dimensions to split traffic further within the segment comparisons
Segment comparisons and dimensions make it easier to identify traffic sources and customer journeys, and give a concrete picture of the users who drop off and those who stay.
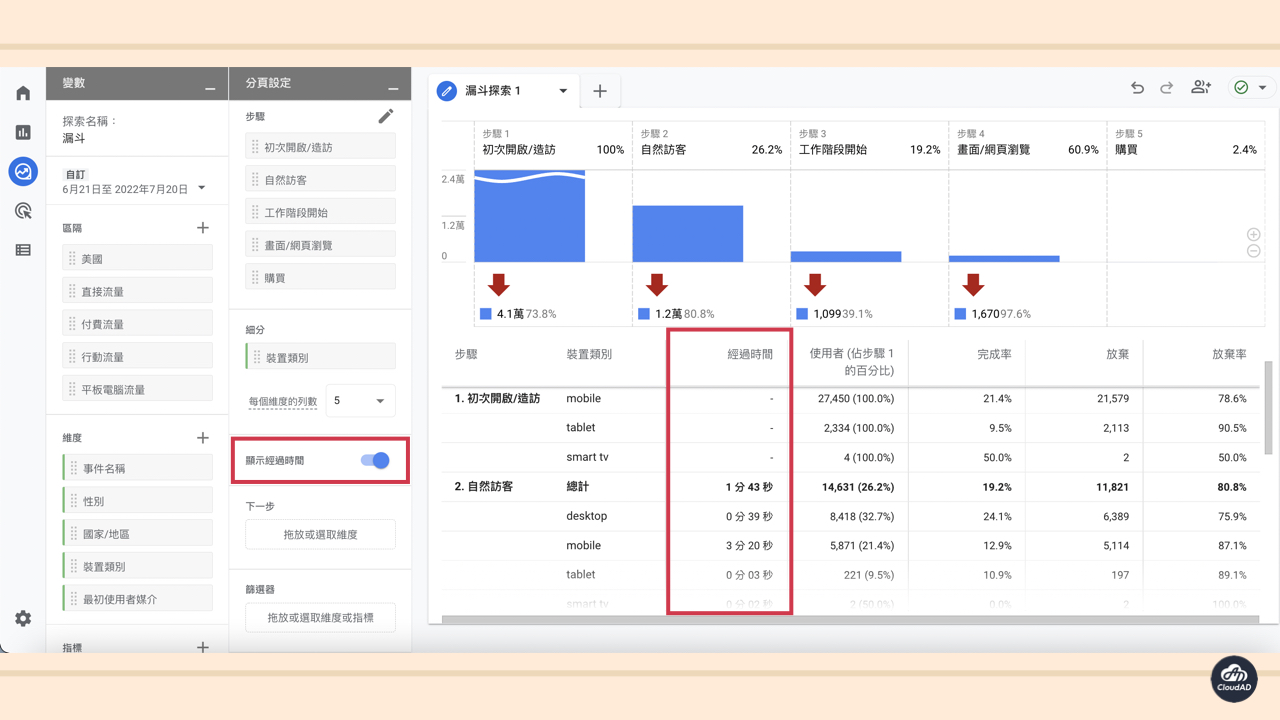
- Show elapsed time: shows the time taken between two steps
Turn on Show elapsed time and the report displays the average time users spend at each step. Knowing how long passes between actions helps us understand users’ behaviour and decision cycles, and gives a reference point for the sales timeline of a product or service. Elapsed time can also serve as an optimisation metric for the following goals:
- Analyse behaviours that take a long time to convert, and test different marketing approaches to shorten the purchase journey
- Combine segments with elapsed time to compare how users behave on the website across different campaigns, devices, traffic sources and other factors
- Check whether the website’s page design meets customers’ expectations, and find what to adjust on the site
- Next action: add an event name to see a list of the steps users take next
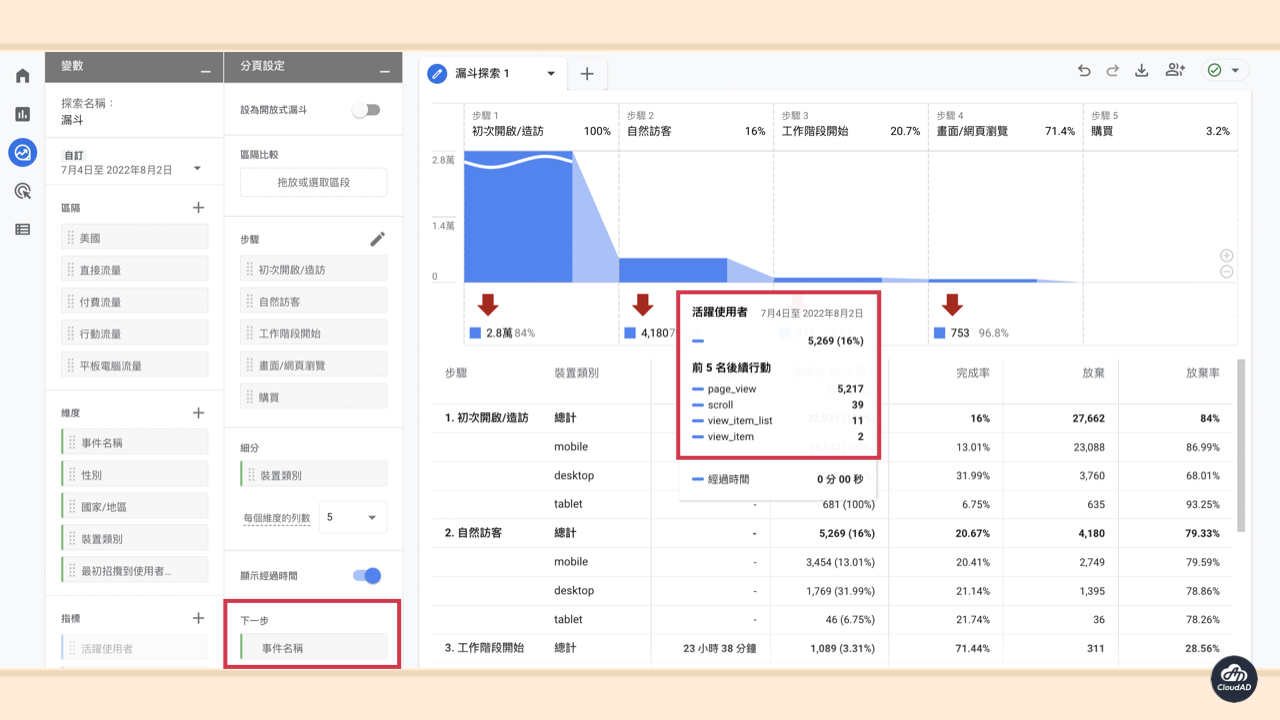
The GA4 Funnel exploration report uses a funnel to show changes across a process at a glance. Custom reports can also be adjusted to a brand’s marketing goals to surface the business insights that matter most. If you have any questions about GA4 or would like to discuss our services, get in touch.