
In the competitive world of digital advertising, data analysis is no longer the preserve of data scientists. It is an essential skill for digital marketers. Used well, data analysis lets you see what is really happening in messy data, understand your target audience precisely, improve ad performance and, in turn, raise your return on investment.
The data analysis process
This flowchart simplifies the data analysis process, condensing complex steps into four that are easier to understand and carry out. With it, digital marketers can analyse data more efficiently, find the meaning behind the numbers, make better decisions and improve campaign results.
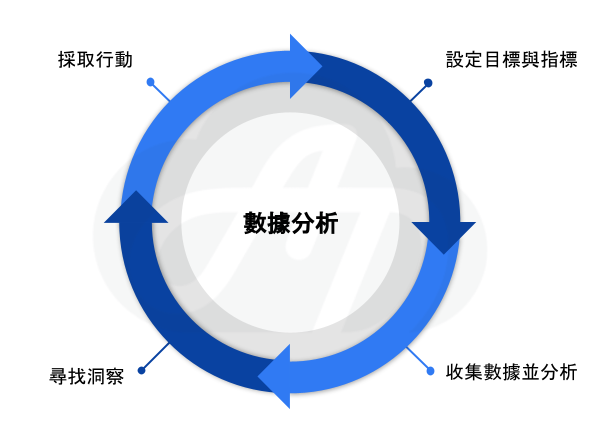
Step 1: Set goals and metrics
First, decide what your marketing goal is: for example, raising brand awareness, increasing website traffic or growing sales. Then identify the metrics that relate to that goal, such as click-through rate, conversion rate and cost efficiency, to measure how your campaigns perform.
Common metrics in data analysis
Every platform offers a wide range of metrics. The most important for digital marketers include:
-
Traffic metrics: visitors, page views, engagement rate and so on. These show whether your ads are attracting your target audience.
-
Conversion metrics: goal completions, conversion rate and so on. These show whether your ads are meeting your marketing goals.
-
Cost metrics: ad spend, cost per click, cost per conversion and so on. These show whether your ad spend is reasonable.
Step 2: Collect and analyse data
Collect relevant data from your data sources, such as Google Analytics, Google Ads and Facebook Ads Manager. Use data visualisation tools to carry out an initial analysis and look for trends and patterns.
If you are new to data analysis, start with the platform you know best and use most, or the one that fits your goal best. Begin with simple data and build up your analysis skills gradually.
Step 3: Find insights
Analyse the relationships in the data to identify the key factors that affect campaign performance, such as ad copy, creative, timing, target audience and marketing channel, and make practical recommendations.
These techniques can help you understand the data more deeply and make better decisions:
-
Compare data across periods: analyse how the data changes over time to see whether your ad performance is improving.
-
Segment groups: split your data by demographics, interests, behaviour and so on, to analyse how different groups respond more precisely.
-
Combine data sources: bring together data from different platforms, such as Google Analytics and Google Ads, for a more complete analysis.
Step 4: Take action
Turn your analysis into a concrete action plan. Most importantly, connect that plan to your marketing strategy. For example:
-
Optimise ad copy: compare the click-through and conversion rates of different ad copy to see which appeals more to users, then revise your copy to improve performance.
-
Adjust ad targeting: analyse how different audiences respond, for example by age, gender and interests, and adjust your targeting to reach your audience more precisely.
-
Optimise ad creative: compare the click-through and conversion rates of different images and videos to see which appeal more to users, then optimise your creative to improve performance.
-
Analyse user behaviour: look at how users behave on your website, such as which pages they view, how long they stay and which links they click, to understand their preferences and design content that better meets their needs.
Data analysis is a process of continuous improvement. By analysing data and refining your ad strategy on an ongoing basis, you can improve results.
Remember, data analysis is not the goal in itself. It helps you make better decisions and reach your marketing goals. If you need data consulting services, get in touch.