In our previous article, a beginner’s guide to standardising UTM parameters to track all your traffic accurately, we learnt how to create clean, standardised UTM parameters so that website traffic carries accurate labels.
But setting up UTMs is only the first step. Perhaps you are staring at a GA4 report with questions such as: “How did my carefully planned summer_sale campaign actually perform?” or “Which has the higher conversion rate, cpc traffic from facebook or cpc traffic from google?”
Don’t worry. Below, we show you step by step how to view UTM traffic in GA4 and how to interpret it correctly, so your traffic data turns into clear marketing insight.
How to view traffic performance in GA4
1. Open GA4 > choose Reports in the left menu > expand Acquisition > choose Traffic acquisition.
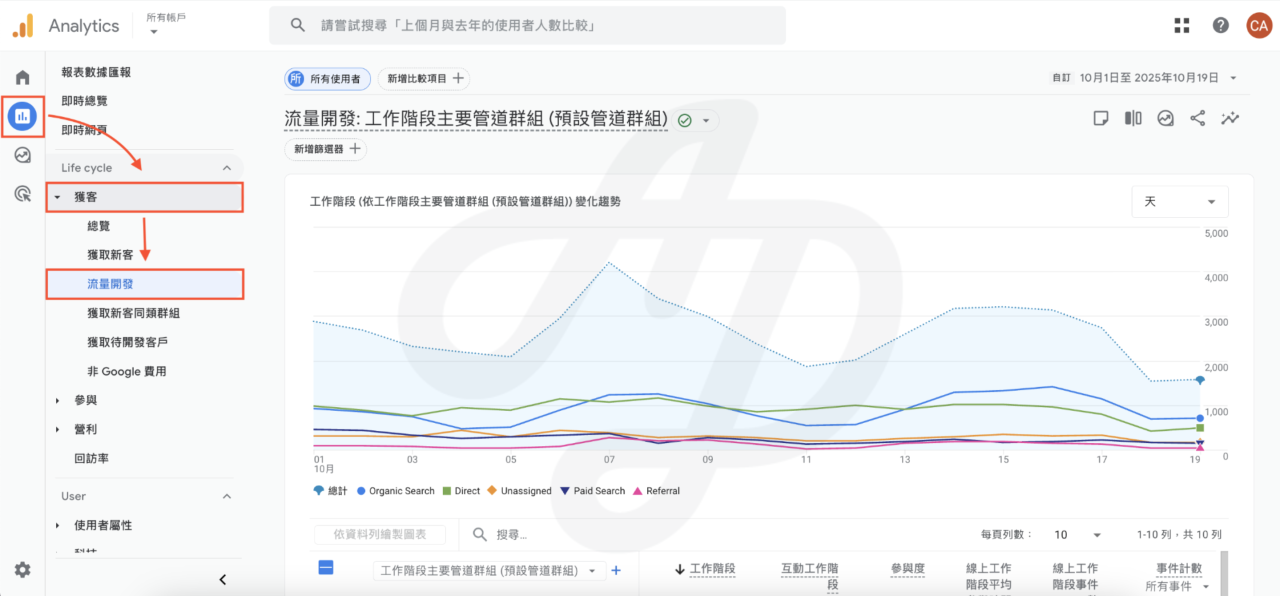
2. Then click “▼” to choose a UTM parameter and view performance for that dimension. For further analysis, click the “+” next to it to add a secondary dimension and see more detailed performance.
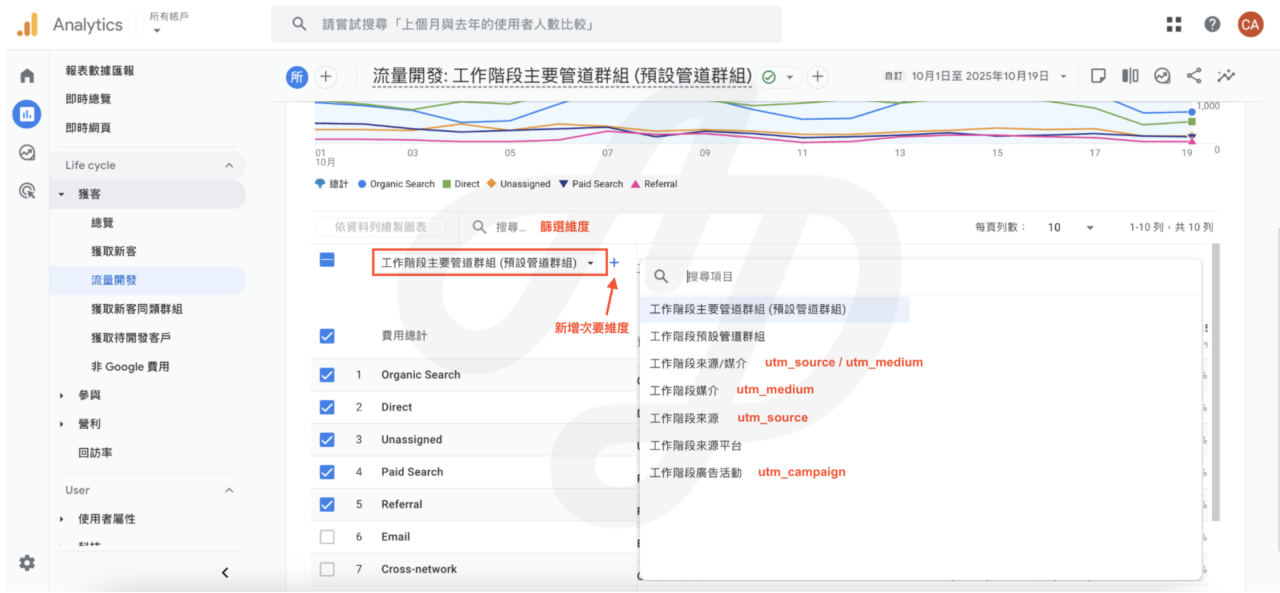
The table below shows which GA4 dimension corresponds to each UTM parameter. To evaluate campaign performance, we recommend the dimensions that start with “Session”, because they focus on what the user is doing in that visit; dimensions that start with “First user” focus on where the user first came from. To learn more about the difference, read how to use GA4 session and first user source / medium to understand the user journey and optimise your marketing strategy.
| UTM parameter | GA4 dimension (single-visit performance) | GA4 dimension (new users) | Example |
|---|---|---|---|
| utm_source | Session source | First user source | |
| utm_medium | Session medium | First user medium | cpc |
| utm_campaign | Session campaign | First user campaign | summer_sale_2025 |
| utm_content | Session manual ad content | First user manual ad content | banner01 |
| utm_term | Session manual term | First user manual term | merch |
Note that GA4’s Traffic acquisition report does not show utm_content and utm_term by default. To see how these two parameters perform, use Explorations, which lets you look more closely at the effect of different content or keywords.
How to read the key performance metrics
When analysing traffic data, a few key metrics help you judge traffic quality and performance:
| Metric | Meaning | Why it matters |
|---|---|---|
| Sessions | A period in which a user visits the website | Every user’s visit is different, so a common unit of measurement is needed |
| Engagement rate | Whether there was real interaction with the website | A quality metric that shows whether the traffic is good quality |
| Average engagement time per session | Average time spent per visit | A quality metric that shows whether users are actually reading the content |
| Events per session | Whether users complete the desired actions (clicks, add to cart) | A quality metric that measures how active the interaction is |
| Key events | Whether a conversion action was completed | A performance metric that shows how much business the traffic brings |
| Session key event rate | Sessions with a key event ÷ all sessions for that traffic | A performance metric for comparing conversion efficiency across sources; it is each source’s own rate, not each source’s share of the overall contribution |
Tip: different marketing goals call for different metrics:
- If your goal is the number of orders focus on traffic with a high session key event rate. This is the traffic that actually drives sales.
- If your goal is brand building or content engagement focus on engagement rate and average engagement time. These show that the traffic is good quality and users are really interacting.
Remember: metrics are only tools. Start by being clear about your marketing goal, then choose the data that best reflects the result.
Example scenario
Q: The campaign “summer_sale_2025” ran Meta Ads (UTM source / medium = facebook / cpc) and sent an EDM (UTM source / medium = edm / email). The boss wants to know how each channel performed and what to do next. How should you approach this?
- Go to the Traffic acquisition report > set the primary dimension to Session campaign and the secondary dimension to Session source / medium > filter for “summer_sale_2025” in the search box.
- The resulting data (illustrative):
Session campaign Session source / medium Sessions Engagement rate Average engagement time Key events (purchase) Session key event rate summer_sale_2025 facebook / cpc 9,500 70.5% 01:18 320 3.36% summer_sale_2025 edm / email 1,800 82.6% 01:15 95 5.28%
3. Data insights
- Traffic volume: Meta Ads brought 9,500 sessions, about five times as many as the EDM, showing strong reach and exposure.
- Traffic quality: Average engagement time is similar for both, but the EDM’s engagement rate of 82.6% is clearly higher than Meta Ads’ 70.5%, showing that this audience is more willing to engage in depth.
- Conversion performance: The EDM’s purchase rate of 5.28% is higher than Meta Ads’ 3.36%, meaning this channel’s audience is more likely to buy.
4. Direction for marketing decisions
- The two channels serve different goals: Meta Ads suits acquiring new customers and extending reach, while the EDM focuses on nurturing existing customers and converting efficiently.
- Meta Ads: we recommend optimising the landing page or the checkout flow to improve engagement and purchase rate.
- EDM: although the traffic volume is smaller, conversion efficiency is high. Keep nurturing these high-value existing customers, for example through member remarketing, exclusive offers or segmented content, to increase customer lifetime value.
5. Overall recommendation
“More traffic ≠ better conversion.” We recommend a two-track strategy of new customer acquisition plus existing customer remarketing, so that traffic volume and conversion quality grow together and form a healthy marketing funnel.
Conclusion
UTMs are like a GPS for your campaigns, labelling every traffic source, and GA4 is a powerful tool for analysing traffic quality and performance. Master both and learn to read GA4 reports correctly, and you can move out of the fog of not knowing where your traffic comes from, clearly identify which campaigns and content actually drive conversions or engagement, and build a solid basis for optimising your next marketing strategy.
Want a more accurate grip on your GA4 data but worried your basic setup is wrong? Or you understand your traffic performance but are unsure how to turn it into a concrete marketing strategy? Our data team offers GA4 diagnostics and ongoing consulting support to help put strategy into practice. To make data a driver of your growth, get in touch.