KEY POINTS
Key points
- It helps to look at noticing, trusting and deciding separately. One platform rarely shows the whole choice.
- Three studies are often quoted as proof of shrinking attention spans. Each measures something different, and none shows that consumers have simply become impatient.
- Age is a useful starting point. The same person can behave very differently from one situation to the next.
- Pew found that 8% of Google searches with an AI summary led to a click on a regular result. Without a summary, the figure was 15%. When traffic falls, lower demand and answers found before the visit are two different explanations.
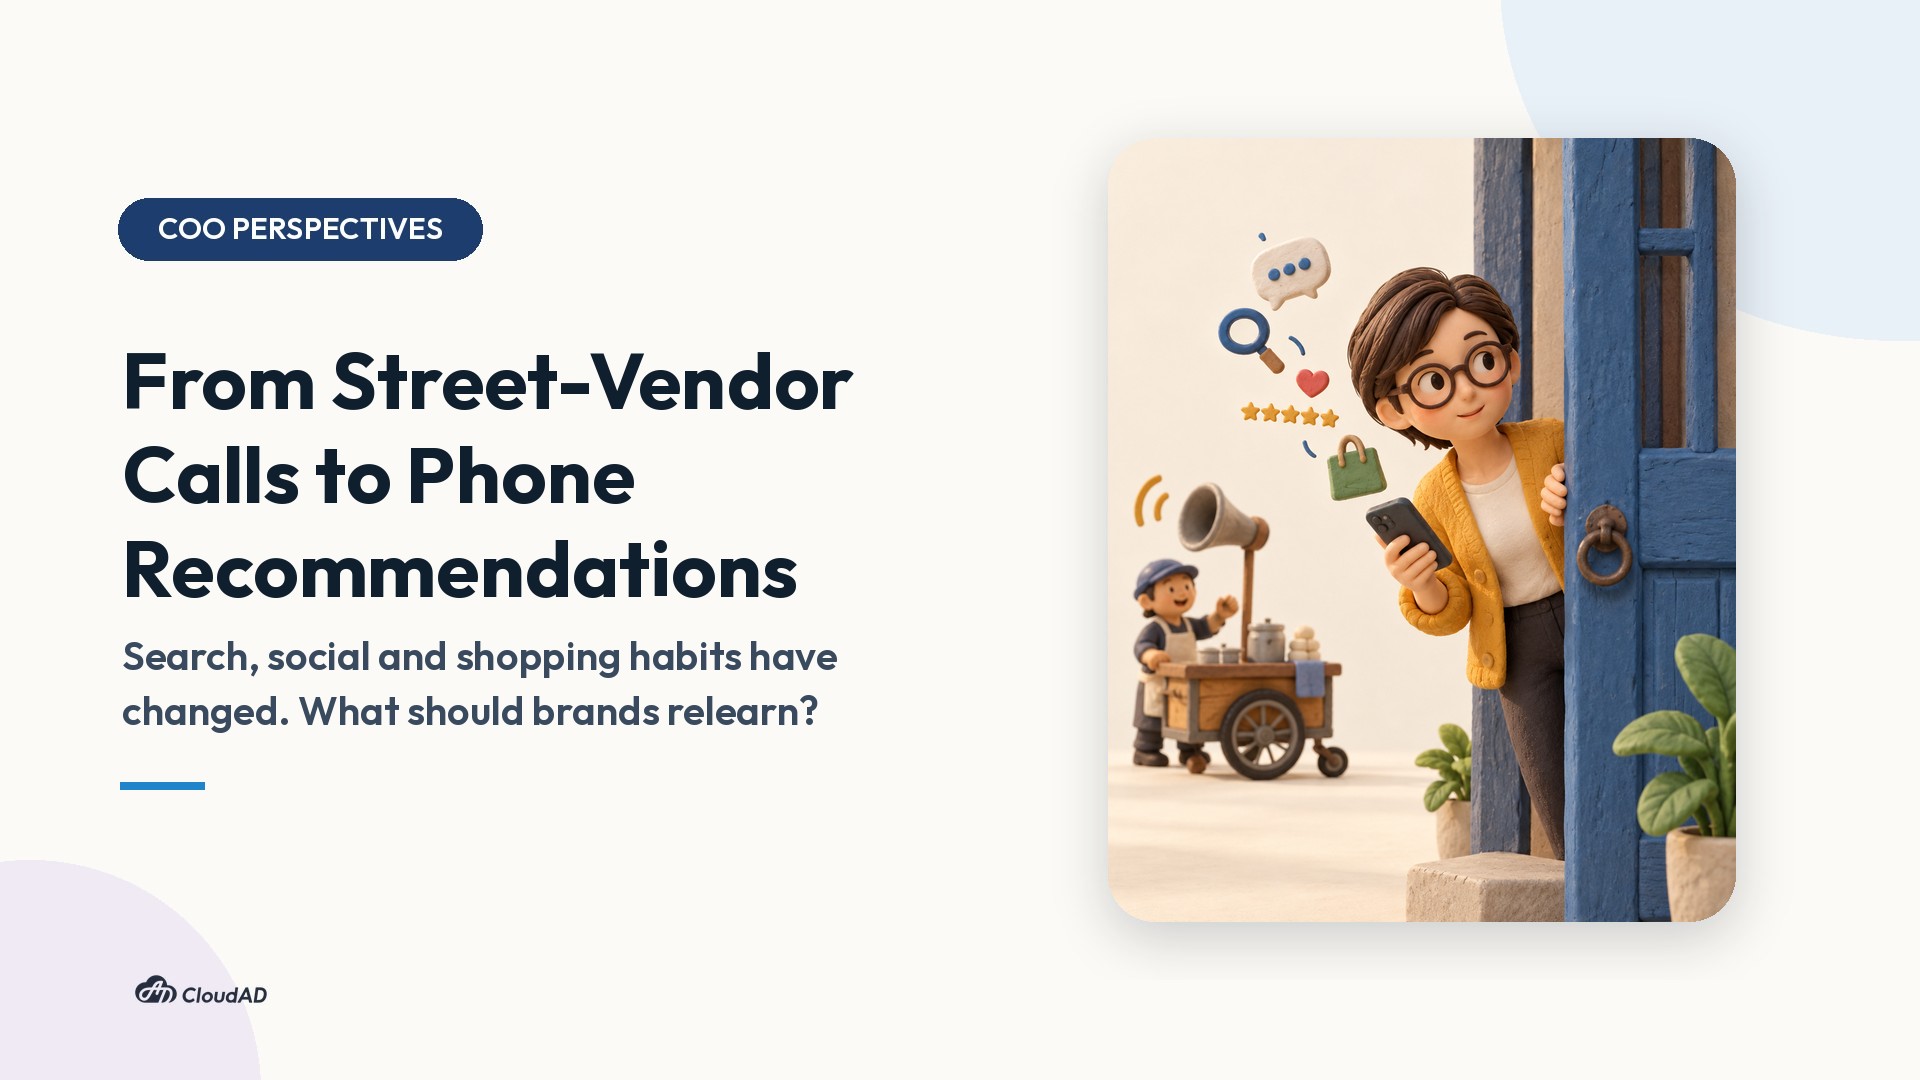
When I was a child, some products and services first reached me as sounds.
In Taiwan, voices drifted down the lane. One offered to sharpen knives and scissors and fit new knife handles. Another offered to repair window screens and replace glass. And there was the call of the Caohu taro ice vendor from Taichung.
I still remember those calls. When one came from the end of the lane, the adults at home stopped what they were doing. They leaned out to look, then decided whether to go outside.
Later, advertising meant flyers in the mailbox, newspaper pages, street posters and notices taped to utility poles. Then came search, social media and the recommendations on phones.
Putting those memories next to recent research, I started to wonder. Has only the channel changed? Or has the way people decide what to notice, whom to trust and what to buy changed too?
I am not only asking how younger people differ from my generation. Having lived through each of these shifts, I know my own habits keep changing as well.
For brand and marketing teams, that may be the thing most worth keeping up with.
Where people are matters less than what they do there
When I try to understand a purchase, I separate three things: how someone noticed the product, why they trusted it, and what made them buy.
Hearing the taro ice call is one thing. Walking out the door to buy a cup is another. Was it a craving? A good experience last time? Or had a neighbor just bought one?
Now imagine someone today. They see a product on social media, search for prices and ask an AI tool about specifications. Then they try it in a store and finally order it from a familiar online shop. Looking at only one of those platforms, how much of that choice can a brand see?
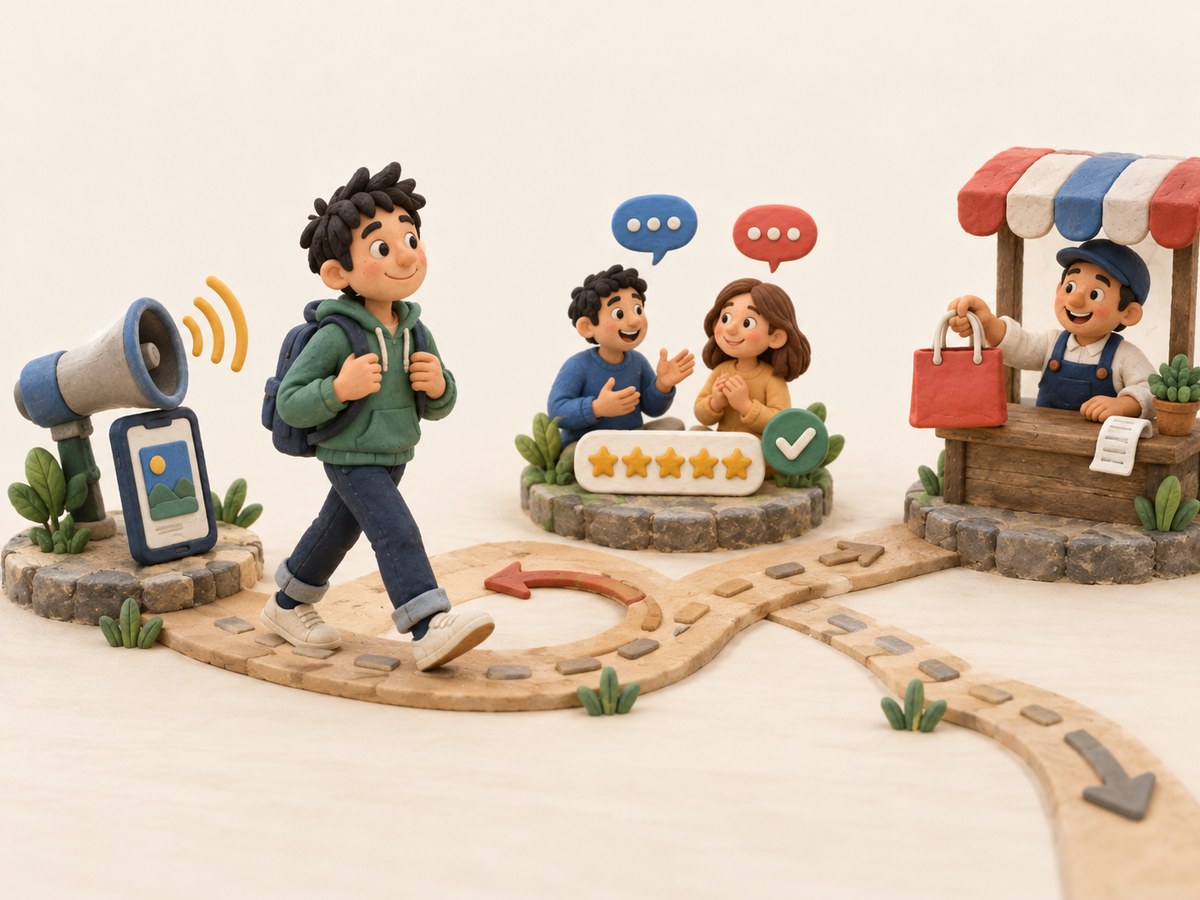
This is not a new fixed customer journey either. Some people skip comparison entirely. Some read everything and still do not buy. Some have trusted a brand for years and are waiting for the right moment.
Even whether someone checks information should not be assumed. The Taiwan Network Information Center (TWNIC) asked internet users how often they judge whether online information is true. In its 2025 Taiwan Internet Report, 13.60% answered often or always. Another 65.91% answered never or rarely[1].
That describes general online habits. It does not show that most consumers trust brands without checking, and it does not explain where trust comes from. Still, it reminds me not to picture every customer as a careful, thorough, rational buyer.
So instead of only asking where people are, I would rather ask what they do there. Which unanswered question carries them to the next place?
Are attention spans shrinking, or are conclusions coming too fast?
Several studies do show changes in attention. But they measure different things, and their conclusions are more cautious than the versions shared online.
It is easy to say that people have less patience than before. I wanted to start this piece there too. Reading the research again, I found that numbers often quoted together answer different questions.
Switching between screens
In a 2023 interview, Gloria Mark of the University of California, Irvine, looked back on her research. In 2003, people stayed on one screen for about two and a half minutes before switching. Later studies observed an average of about 47 seconds[2].
That describes attention moving between screens at work. It does not mean the brain can only focus for 47 seconds. It is not an average attention span for consumers either.
Short video and attention
A 2025 meta-analysis in Psychological Bulletin covered 71 studies and 98,299 participants. It found that heavier short-form video use was associated with poorer attention and inhibitory control[3]. Most of the included studies were correlational, so the direction of the effect is still unclear.
This deserves attention. But it does not mean short videos destroy the ability to think. Nor does it mean every brand message should be as short as possible.
In Taiwan, the same TWNIC report found that 78.46% of respondents had watched short videos in the past three months. About three quarters of those viewers (73.98%) watched every day[1]. That shows how common the habit is. It does not measure anyone’s attention.
How fast topics fade
A third kind of change concerns how a crowd moves between topics. A 2019 study in Nature Communications found collective attention speeding up across several data sets. On Twitter, the average time a hashtag stayed in the top 50 fell from 17.5 hours in 2013 to 11.9 hours in 2016[4]. That measures how quickly topics rise and fade, not how well an individual can focus.
What I take from the three studies
After reading these studies, I am less willing to blame impatience every time someone does not stop. People leave content for many reasons. They may be interrupted. They may have found the answer already. Or they may have decided it was not what they needed.
And if a video holds someone for a long time, but they still cannot tell whether the product suits them, what did that attention achieve?
Brands need to earn attention. They also need to know what to help with once they have it.
Age helps explain people, but cannot replace understanding them
Generational differences are worth looking at. But a chart that says “young people use this, older people use that” is not enough.
What the platform numbers show
The Market Intelligence & Consulting Institute (MIC) in Taiwan published a social media survey in December 2025. Among users aged 18 to 24, 78% regularly used Instagram. YouTube was not just for the young, though. Among those aged 55 to 65, 79.9% used it regularly, compared with 70.6% of 18 to 24 year olds[5].
Those numbers are a starting point. They do not show whether two people opening YouTube want the same thing or will spend the same time.
Pew Research Center also reminds researchers to separate three effects: age, life stage, and the shared period people live through[6]. Not every difference between generations is a fixed trait.
The same person in different situations
Now narrow it down to one person. Would they choose a lunch spot, a laptop and a service for a family member in the same way? Lunch might come down to distance and ratings. A laptop calls for comparing specifications and reading reviews. A service for family might mean asking several people and still having doubts.
So I look at price, familiarity, the cost of a wrong choice and how much time someone has. Birth year is only one factor.
An example from CloudAD’s website
Assuming what readers want shows up in my own work too. In mid-October, CloudAD’s website published several Data Studio guides in Chinese and English. In the first few days, the English versions drew far more search impressions. For the same topic, the English page had 287 and the Chinese page had 13.
A few days of data cannot explain why. More people may search for this kind of tool in English. Or competition in each language’s search results may differ. I did not treat it as a conclusion. But it is why I began writing in English, and why this piece has an English version.
It is also why I do not want to talk only about how young people have changed. What needs updating includes my own picture of people.
With AI in the picture, what happens after the answer?
People are still looking for answers. What has changed is what they do once they find one.
How many people use AI
AI is already part of many people’s routines. In the 2025 Taiwan Internet Report, 43.19% of respondents had used generative AI in the past three months[1]. A Pew survey from the same year found that 34% of US adults had used ChatGPT, rising to 58% among adults under 30[7]. The two surveys asked about different tools and periods, so they should not be compared directly.
Rather than asking who uses AI more, I want to know what people hand over to AI. What do they still want to check for themselves?

What happens to clicks
Another Pew study tracked the browsing of 900 US adults. When a Google results page showed an AI summary, 8% of visits led to a click on a regular result. Without a summary, the figure was 15%[8]. This compares different search situations. It does not prove that AI summaries caused the gap.
It adds one more question when I look at website numbers. Is lower traffic a sign of lower demand? Or were some questions answered before people reached the site? Both explanations need evidence. A drop in traffic does not always mean a brand has lost its appeal. And “everyone gets answers elsewhere now” is no reason to stop investigating.
Getting an answer does not always mean stopping there, either. The Reuters Institute’s Digital News Report 2026 looked at people who use AI chatbots for news. Of them, 42% say they always or often click through to the original sources[9]. That is self-reported behavior in a news context. It cannot be compared with the browsing data above, and it should not be applied to shopping.
What shoppers expect from AI
On shopping, an MIC e-commerce survey published in June 2026 asked which AI services consumers would like. AI price comparison came first at 68.7%. Search recommendations and review summaries were also in the top five[10]. These are expectations, not behavior that has already happened.
So I ask two questions. If consumers want AI to help them compare, has the brand made its information easy to compare? And if someone has already read a summary, what else do they need to decide?
Seen this way, I am in no hurry to ask which platform AI will replace. I would rather know which part of the choice it has changed. Then I can ask which of a brand’s habits need to change with it.
Back at work, here are three things I would do first
Research can point in a direction. Decisions about budget, content and service still have to come back to real customers.
Ask about the most recent real choice
Instead of asking which platforms customers usually use, I would ask about their last purchase. I would also ask about a time they decided not to buy. How did they first notice it? What did they look up? Which piece of information changed their mind? What finally made them buy or walk away?
The people who did not buy matter most. I do not want them to stay a non-conversion in a report.
Memories are incomplete, so I would compare these answers with search, website, customer service and order data. Reports cannot answer every question. And one persuasive story is not how every customer behaves.
Make things quick to understand, with room to dig deeper
I would not turn “people read faster” into “everything must be shorter”. Instead, I would check three moments. On first contact, can someone quickly tell what this is and who it is for? When comparing, can they find differences, limits and conditions? When ready to buy, are price, delivery and after-sales service clear?
If someone wants to know how two plans differ, another eye-catching video may not help. What is missing may be a clear comparison that is honest about limits.
Say what behavior each change should shift
Content that introduces a brand and content that resolves a buyer’s doubts need different tests. For the first: did it reach the right people, and did they understand the message? For the second: were their questions answered? Views, engagement, inquiries and purchases are all clues. None of them can stand in for another.
I would also ask the team to be specific. What problem is this change meant to solve? Which behavior should change? What evidence would show that it worked? I hope discussions end there, not at “lots of people watched this video” or “this platform is hot right now”.
Back to the lane
When a call came from the end of the lane, the adults would lean out, look, and decide whether to go outside.
In that small movement was a direct judgment: does this have anything to do with me?
Looking back, I do not want to simply miss a time when ads were easier to remember. Nor do I want to label people today as less patient.
What I care about more is this. Standing on the side that sends the message, have I really taken the time to understand the person on the other side?
When they do not stop, I want to find out why. Did they not need it, or did the message never answer what they cared about?
Frequently asked questions
Is the human attention span now only 47 seconds?
No. The 47-second figure comes from Gloria Mark’s research on digital work. It describes how long people stay on one screen before switching. It is not a limit on how long the brain can focus, and it is not the average attention span of consumers.
Does an AI summary in search results always reduce website traffic?
Not necessarily. Pew observed an 8% click rate on regular results when an AI summary appeared, and 15% when it did not. But this compares different search situations, so it does not prove the summary caused the gap. When traffic falls, both lower demand and answers found before the visit need checking.
Do different generations really use different platforms?
There are differences, but they are less clear-cut than platform charts suggest. In the MIC survey, 78% of 18 to 24 year olds regularly used Instagram. Meanwhile, 79.9% of 55 to 65 year olds regularly used YouTube, more than the 70.6% of 18 to 24 year olds. Pew notes that age gaps may reflect life stage or shared history, not fixed traits.
How can a brand find out where customers make decisions?
A direct way is to ask customers about their most recent purchase, or a time they did not buy. Ask how they noticed it, what they looked up, what changed their mind and why they decided. Then compare those answers with search, website, customer service and order data. Memories are incomplete, and reports miss people who never arrived, so the two work best together.
Start with the data at hand
Understanding customers can start with one interview. It can also start with reading the reports already at hand. CloudAD’s Data Studio templates and tutorials site (in Traditional Chinese) explains how to read search, social and e-commerce reports. Read the numbers clearly first, then compare them with real choices. The next questions become easier to see.
Further reading
- Search Console basics: how to read impressions, clicks, CTR and average position (in Traditional Chinese)
- How to read social media reports: reach, impressions, engagement and referral traffic (in Traditional Chinese)
- E-commerce reporting basics: revenue, orders, average order value and conversion rate (in Traditional Chinese)
- From Sessions to Answers: in the age of AI search, brands need to measure more than traffic
References
These ten sources measure different people, places and questions. Some cover screen switching at work, some are correlational, some report self-described behavior in news, and some measure consumer expectations. They are used together to ask better questions. Before borrowing any single figure, check its scope. The impression figures for CloudAD’s Data Studio guides come from cloudad.tech’s own Search Console.
- Taiwan Network Information Center (TWNIC), 2025 Taiwan Internet Report, summary (published 17 December 2025; fieldwork 28 July to 1 September 2025; 2,142 valid responses; in Chinese): https://report.twnic.tw/2025/en/assets/download/TWNIC_TaiwanInternetReport_2025_CH_summary.pdf
- University of California, “Can’t pay attention? You’re not alone”, interview with Gloria Mark (2023): https://www.universityofcalifornia.edu/news/cant-pay-attention-youre-not-alone
- Nguyen, L. et al. (2025). Feeds, feelings, and focus: A systematic review and meta-analysis examining the cognitive and mental health correlates of short-form video use. Psychological Bulletin, 151(9), 1125–1146. doi:10.1037/bul0000498
- Lorenz-Spreen, P., Mønsted, B. M., Hövel, P., & Lehmann, S. (2019). Accelerating dynamics of collective attention. Nature Communications, 10, 1759: https://pmc.ncbi.nlm.nih.gov/articles/PMC6465266
- Market Intelligence & Consulting Institute (MIC), Institute for Information Industry, social and messaging behavior survey (4 December 2025; in Chinese): https://mic.iii.org.tw/news.aspx?id=744
- Pew Research Center, “How Pew Research Center will report on generations moving forward” (22 May 2023): https://www.pewresearch.org/short-reads/2023/05/22/how-pew-research-center-will-report-on-generations-moving-forward/
- Pew Research Center, “34% of U.S. adults have used ChatGPT, about double the share in 2023” (25 June 2025): https://www.pewresearch.org/short-reads/2025/06/25/34-of-us-adults-have-used-chatgpt-about-double-the-share-in-2023/
- Pew Research Center, “Google users are less likely to click on links when an AI summary appears in the results” (22 July 2025): https://www.pewresearch.org/short-reads/2025/07/22/google-users-are-less-likely-to-click-on-links-when-an-ai-summary-appears-in-the-results/
- Reuters Institute for the Study of Journalism, Digital News Report 2026, Executive Summary (June 2026): https://reutersinstitute.politics.ox.ac.uk/digital-news-report/2026/dnr-executive-summary
- Market Intelligence & Consulting Institute (MIC), Institute for Information Industry, e-commerce market trends and consumer survey (30 June 2026; in Chinese): https://mic.iii.org.tw/news.aspx?List=1&id=765