
There is only one truth, and only one goal
Before explaining how to review performance in the ad platform, there are some basic concepts to cover. As mentioned in the previous article, whenever we carry out any digital marketing activity, it must have a purpose (if an activity has no purpose, you are better off saving the money). Even running ads so the boss notices them and can see them is, in fact, a purpose. So before you start reviewing performance, first confirm the purpose of this GDN campaign. Only then can we look at the right metrics. Many students ask: “There are so many metrics in the reports, I don’t know which ones to look at.” If you have this question, your purpose may not be very clear.

For GDN ads alone, the purpose usually falls into one of two types: impressions or clicks. (More advanced performance reviews still need Google Analytics, but we won’t cover reviewing performance in GA in this post.) For example, if the goal of a GDN campaign is impressions, the metrics to refer to might be impressions, CPM, frequency and viewable impressions. If the goal is clicks, the metrics might be clicks, CPC and CTR. But if the ad’s goal is clearly impressions and you get caught up in click-oriented metrics (such as CTR), running the campaign can become a dilemma. So before reviewing performance, confirm your ad goal before taking action, to avoid a mistaken review affecting later decisions.

The report areas
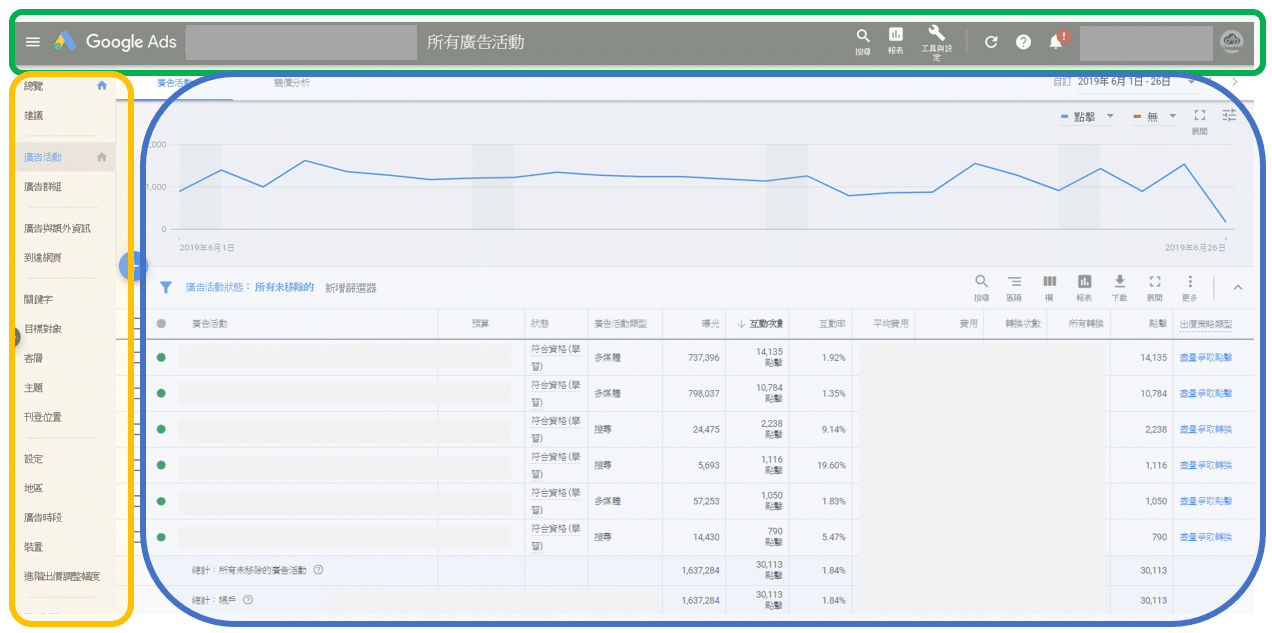
First, a quick overview of how the ad platform is laid out, so you can better understand its structure. There are three main areas: the yellow box on the left is where you choose what to analyse and set up ads; the green box at the top is where you set the date range and platform and report settings; and the blue area in the middle is the key metrics report area. Today we will focus mainly on the blue report area.
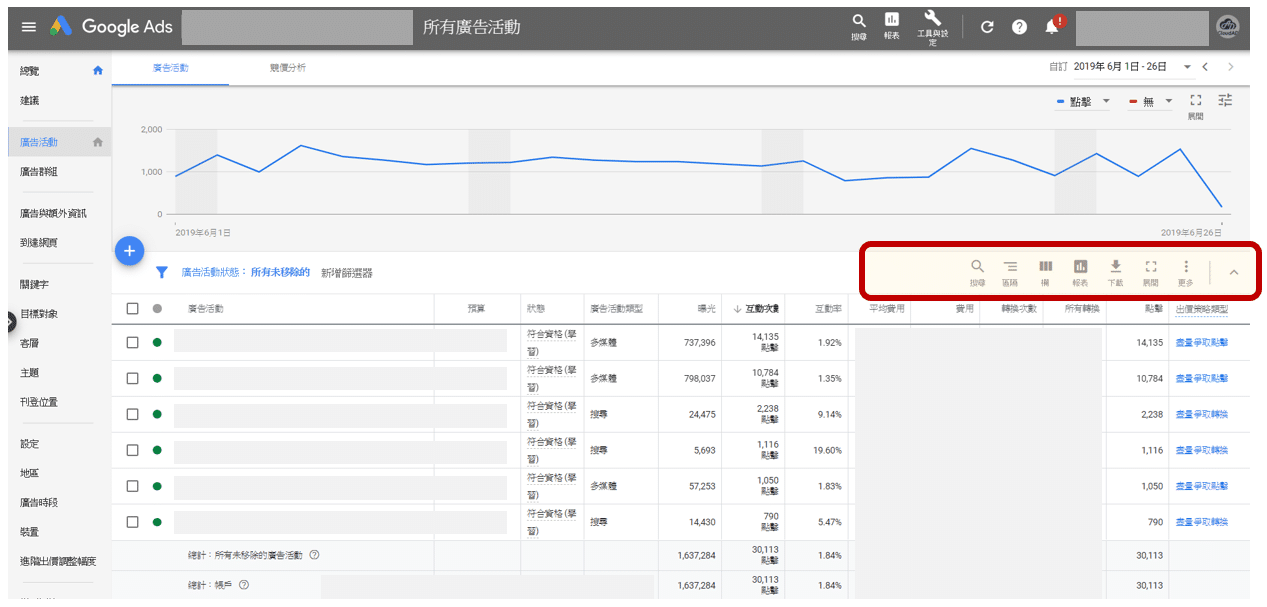
As shown below, the red area is the settings area, where you can adjust how the report is displayed (such as the metrics and dimensions you want to see) and download the report.
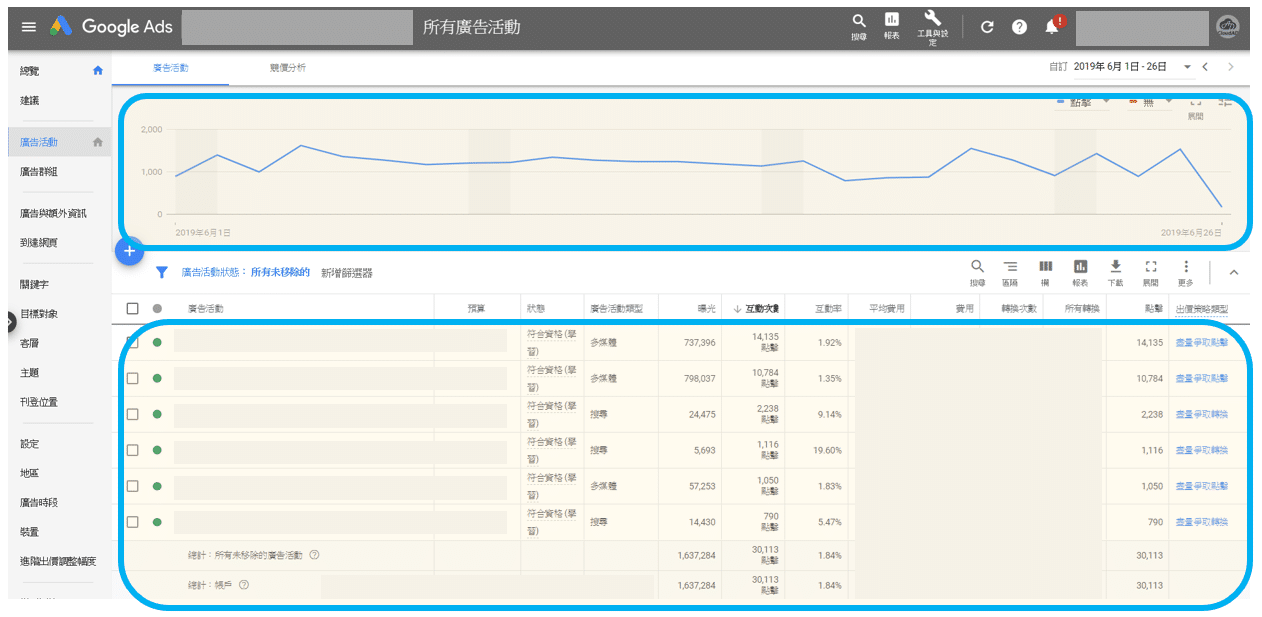
As shown below, the blue area is the report view. First set the metrics you want to view and the date range; once set, the performance report appears here.
Basic GDN performance metrics
Clicks: simply the number of times the ad was clicked. You may sometimes find that today’s figure differs from what you saw yesterday. This is because after a click happens, Google decides whether it is an invalid click. If it is judged invalid, the system automatically deducts that click and its cost.
Impressions: some students think impressions are the number of people who saw the ad, but that is far from the case. Impressions are simply the number of times the ad was shown. For example, if the same person is shown the ad 10 times, impressions will be 10, not 1.
Click-through rate (CTR): the percentage obtained by dividing ad clicks by ad impressions (CTR = clicks ÷ impressions × 100%). It is mainly used to judge how appealing the ad is: the higher the CTR, the more likely people are to click the ad.
Unique users: this is the number of people who saw the ad, as described above: the total number of users who saw the ad in a given period. The system calculates it using cross-device data, since users may see the same ad on different devices. It is mainly used to count how many “people” the ad has reached.
Average impression frequency: the average number of times each user saw the ad. For example, an average frequency of 3 means that all the users your ad was served to saw it 3 times on average. Keep an eye on this metric, as too high a frequency can put consumers off.
These are the basic metrics to watch when running GDN ads (and, of course, cost). They give an initial view of the ad’s appeal, reach and frequency. We also recommend turning on other metrics and reviewing them together, both to understand what other metrics mean and to make your performance analysis more objective.

Conclusion
The metrics in this post are only the tip of the iceberg, but there is no need to worry. You don’t have to track every metric or fully understand them all. Just focus on the metrics related to your ad goal, as described in the first section. Considering too many metrics at once can cause confusion. For example, if the ad goal is impressions but you also want to raise the click-through rate (CTR), impressions and CTR point in different directions; strictly speaking, they work against each other and cannot be optimised at the same time. So remember to clarify your goal before you start analysing ad performance, to avoid doing twice the work for half the result. If you are interested in any of the above, let CloudAD help you enrich your marketing strategy. Get in touch.